Friday, December 11, 2009

Creating Custom Caspian Controls

Creating custom controls in JavaFX is not difficult. Creating custom controls that fit nicely with the default Caspian theme, with its pervasive use of gradients and animation, is a little trickier. This is only because the utility classes and methods that make it simple lie buried within com.sun packages that are not publicly documented. A little digging reveals a few gems that can be used to make your controls fit right in with the core JavaFX controls.
If you are observant, you will not fail to notice that this post also serves to emphasize some of the many reasons that I love, and love working with, Caspian.
Warning #1 This post is not an introduction to writing controls in JavaFX. I will not cover the basics of the Control - Skin - Behavior classes. A quick and simple tutorial on this topic can be found here.
Warning #2 All of the information in this post applies only to JavaFX 1.2.1. One of the dangers of using non-public classes is that they can change significantly from version to version (and they certainly will for JavaFX 1.3). If there is interest, I will update this information after JavaFX 1.3 is released.
Apology #1 I discovered the information I'm about to present here while writing my own controls. None of this should be considered official Caspian documentation since I do not work for Sun and I do not have access to their source code (but hopefully I will when they release the source someday). Everything here is accurate as far as I can tell, but I apologize if I have any of the details wrong. Hopefully someone from Sun will read this and let me know if I've made any mistakes.
Knock-knock Joke #1 (of 100) Knock, knock. Who's there? Yewben. Yewben who? Yewben warned, now on with the post!

Caspian 101 - Colors and Gradients

Caspian controls in JavaFX 1.2.1 all make use of a mixin class called Colorable. This mixin provides the ubiquitous base and accent properties that can be used to style the controls. The base property specifies the base color of the control while the accent property specifies the accent color on those controls that support it. ListView, for example, uses the accent property to specify the color with which it draws the selection highlight in the list. Usage of the Colorable mixin makes Caspian controls incredibly easy to style.
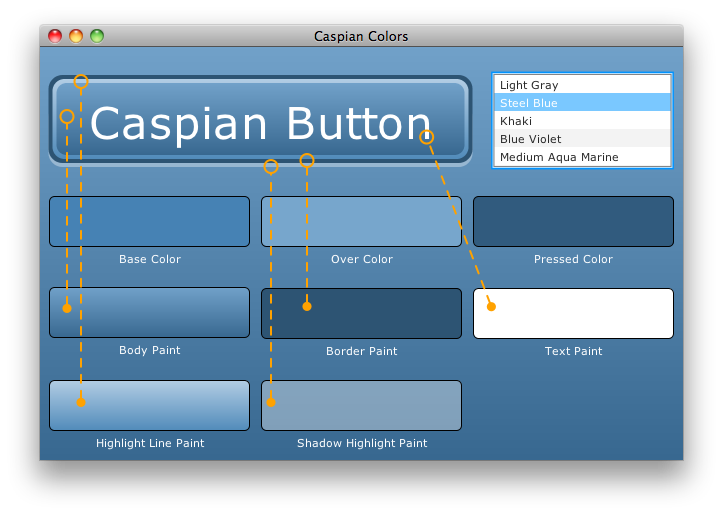
Two other colors are generated from the base color: the over color, which is used when the mouse pointer is over the control, and the pressed color, used when a control is (you guessed it) pressed. Caspian also generates five Paint objects from the base color: the body paint, the text paint, the border paint, the highlight line paint, and the shadow highlight paint. The screenshot below shows an application that displays these various colors and paints. It has been annotated with lines that show where they are used on a Caspian button (click the image to see a larger version).
If you launch the application, you can see that the button is a live control that has been scaled up to four times its normal size. If you hover the mouse cursor over the button or click on it, you will see the control's use of the over and pressed colors as well. Caspian is remarkably clever about generating nice looking controls from a single color.


The Caspian class in the com.sun.javafx.scene.control.caspian package provides easy access to these color-generating capabilities via module level functions:
  • Caspian.getOverColor( base: Color )
  • Caspian.getPressedColor( base: Color )
  • Caspian.getBodyPaint( base: Color )
  • Caspian.getTextPaint( base: Color )
  • Caspian.getBorderPaint( base: Color )
  • Caspian.getHighlightLinePaint( base: Color )
  • Caspian.getShadowHighlightPaint( base: Color )
Therefore, the first step in creating a control that fits in with the native Caspian controls is to use the Colorable mixin class and use it's base property to generate the other colors for your control.
public class MyControlSkin extends Skin, Colorable {

def bodyPaint = bind Caspian.getBodyPaint( base );
def overPaint = bind Caspian.getBodyPaint( Caspian.getOverColor( base ) );
def pressedPaint = bind Caspian.getBodyPaint( Caspian.getPressedColor( base ) );

var mousePressed = false;

def background = Rectangle {
   fill: bind {
       if (mousePressed) {
           pressedPaint
       } else if (background.hover) {
           overPaint
       } else {
           bodyPaint
       }
   }
   stroke: bind Caspian.getBorderPaint( base )
   blocksMouse: true
   onMousePressed: function( me: MouseEvent ) {
       mousePressed = true;
       // ... may also need to notify the Behavior ...
   }
   onMouseReleased: function( me: MouseEvent ) {
       mousePressed = false;
       // ... may also need to notify the Behavior ...
   }
}

// ... I'm too modest to show more skin ...
}
   
With just a few lines of code you get nice Caspian gradients for your control plus your custom control will respond to the same base style property as any core JavaFX control. In this simple example I only changed the body paint in response to mouse events. The core JavaFX controls also tend to update their border and highlight colors in response to hover and pressed events. You can see this when you run the Caspian Colors application above and interact with the button.

Caspian 102 - Animated State Transitions

Getting the colors and gradients right is only half the battle. Caspian also uses nice animated transitions when the control changes its state. For instance, when a button is disabled it doesn't just flip to a disabled state, it animates the transition with a smooth fade of the button's opacity. Similar animations occur when a control gets enabled, gains or loses focus, gets hovered over, or gets clicked. Caspian provides a smooth and fluid user experience.
This is something I want to support in my own controls since I am a subscriber to the Chet Haas school of thought regarding the positive role that good, subtle animation cues can play in a user interface. Animating all of those state transitions could become a real chore, so it's a good thing that you can cheat and take advantage of the hard work already done by the team at Sun. Allow me to introduce you to the States, State, and StateTransition classes. All of these little beauties are found in the com.sun.javafx.animation.transition package.
The State class allows you to define each state of your control. The class has four properties of interest:
idThe name of the state.
defaultState Should be set to true if this state is the one in which your control starts.
active Should be set to true when this state is active. Normally this will be bound to some property of the control. For example, when defining the "hover" state, you would bind the state's active property to the skin node's hover property.
priority An integer value that is used to establish precedence when multiple states are active at the same time.
The StateTransition class derives from Transition and allows you to define the animation that will occur when your control moves from one state to another. The properties of interest in this class are id, fromState, toState, and animation. The fromState property is a string that allows you to specify the id of the state you are transitioning from. Likewise for the toState property.
And finally, the States class keeps track of your control's states and manages the transitions between them. The following code shows an example of the states and transitions for a custom control.
def FAST_TRANSITION = 250ms;
def SLOW_TRANSITION = 500ms;

public class MyControlSkin extends Skin, Colorable {
override var color = base;  // color is another property defined in Colorable

def over = bind Caspian.getOverColor( base );
def pressed = bind Caspian.getPressedColor( base );

var mousePressed = false;

def states = States {
   states: [
       State { id: "disabled", active: bind control.disabled }
       State { id: "armed",    active: bind mousePressed }
       State { id: "hover",    active: bind control.hover }
       State { id: "enabled",  active: bind not control.disabled, defaultState: true }
   ]
   transitions: [
       StateTransition {
           id: "Enter-Enabled"
           toState: "enabled"
           animation: ParallelTransition {
               content: [
                   ColorTransition {
                       colorable: this
                       toValue: base
                       duration: SLOW_TRANSITION
                   }
                   FadeTransition {
                       node: bind node
                       toValue: 1.0
                       duration: FAST_TRANSITION
                   }
               ]
           }
       }
       StateTransition {
           id: "Enter-Hover"
           toState: "hover"
           animation: ColorTransition {
               colorable: this
               toValue: over
               duration: FAST_TRANSITION
           }
       }
       StateTransition {
           id: "Enter-Armed"
           toState: "armed"
           animation: ColorTransition {
               colorable: this
               toValue: pressed
               duration: FAST_TRANSITION
           }
       }
       StateTransition {
           id: "Enter-Disabled"
           toState: "disabled"
           animation: FadeTransition {
               node: bind node
               toValue: 0.33
               duration: FAST_TRANSITION
           }
       }
   ]
}

// ... Move along, nothing more to see ...
}
   
True to the spirit of JavaFX's declarative syntax, all you have to do is declare your states and the transitions between them and the rest is handled for you! You can't ask for easier animations than that.
In addition to those shown above, many controls also have "focused", "focused+hover", and "focused+armed" states defined as well (along with their corresponding transitions). Note that I did not specify any priorities in the State declarations above. That is because the order in which the states are declared establishes a default priority. You only need to specify an explicit priority if you want to override this default. Also note that I didn't specify a fromState in any of my state transitions. I was telling the States class that it can use that transition when entering the target state from any other state. You only need to specify a fromState if you want the transition to be used only when entering a state from one other particular state.
This code makes use of another Caspian gem, the ColorTransition class which is found in the com.sun.javafx.scene.control.caspian package. It will animate the Colorable mixin's color property from one value to another. This is yet another reason to make use of the Colorable mixin in your code - easy color animations!

The Etched Button Control

This control was created because I wanted a close button for the XPane control that looked like it was etched into the background of the title bar. I wanted the etched button to fit in as closely as possible with the other Caspian controls as well. The resulting control is shown in the image below.
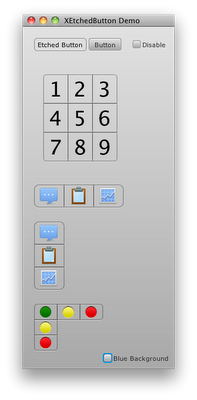
The button features animations for over and pressed states as well as the disabled state. There are a few other nice features as well. The button can display text or a graphic, or both. It can optionally apply an etched effect to its content. The effect is similar to the one Jasper shows in a recent blog post.
Clicking on the disable check box will disable both the etched button and the normal Caspian button. You can also compare their over and pressed animations to verify that they are a close match. This control shows that it is possible to match the look and feel of the Caspian controls very closely by simply using some of the classes that are provided with the standard JavaFX runtime.

P.S.

Knock, knock. Who's there? Yewer. Yewer who? Yewer afraid I was going to tell 100 knock-knock jokes weren't you!
Wednesday, December 2, 2009

Kids + Robots = FUN!

Every year from August to December, somewhere between 90 and 99.9 percent of my free time is taken up as a volunteer helping to organize the Poudre Qualifier, a regional FIRST LEGO League robotics tournament. FIRST LEGO League (or FLL) is a robotics competition for teams of kids from 9 to 15 years old. At the Poudre Qualifier, we host over 300 kids on 48 teams. These kids have spent the last 2 months (or more) building a robot using a LEGO MindStorms robotics kit and creating a research project. Their robot will try to do as many missions as possible on a 8-foot by 4-foot playing field in two and a half minutes.
Of all of the FIRST (For Inspiration and Recognition of Science and Technology) robotics competitions, FLL is unique in that the robot is completely autonomous. It must be smart enough to go out and accomplish its missions and return to base all on its own. If the kids have to rescue the robot out on the table they incur a penalty. Here is a video of a robot doing its thing during a past competition. The kids also do a research project based on the theme of that year's competition. Recent themes have included nanotechnology, energy, and transportation. At the tournaments, a team presents their research project to a panel of experts. Teams are also judged on a technical interview, where they answer questions about their robot's design, construction, and programming; as well as a teamwork exercise to test their ability to solve problems as a team.
With well over 100,000 kids on over 15,000 teams all over the world, FLL is a terrific program for getting young people interested in science and technology in an exciting and fun way. By talking to and learning from experts, kids find out that they can use science and technology to make a positive difference in their world. They also learn many valuable life skills for a future engineer or scientist: teamwork, public speaking, being interviewed, working and performing under the pressure of deadlines, and most of all, how to compete while treating teammates and opponents with respect and courtesy. That is a concept called Gracious Professionalism and it is the core value of FIRST.
What FIRST really needs is volunteers who want to share their passion for science and technology with a new generation of enthusiasts. So my request to you, dear reader, is to find a FIRST event near you and volunteer! Be a referee, a judge, a coach... whatever you want. Just get involved! It will only cost you a few hours or a day, and I guarantee that you will have an amazing time. All of the FIRST events are free and open to the public, so you can also come out and watch these kids having a great time solving difficult problems. If you live here in Colorado, we have the state championship tournament coming up. Information can be found here. And by the way, more photos from our tournament can be found here.

Friday, October 2, 2009

JavaFX Interview

The folks at Sun were kind enough to ask me to visit with them about one of my favorite subjects: JavaFX.
Check it out if you're so inclined.

Sunday, August 23, 2009

Flex 4 vs JavaFX 1.2: Dance Battle

I make it a point to follow Chet Hass on his Codedependent blog. He always has something interesting to say about features in Flex. Even though I rarely use Flex, he often demonstrates interesting animations or visual effects.

His latest post talks about the new transform effects in the upcoming Flex 4. Specifically he uses move (translate), rotate, and scale transforms to manipulate a control and make it twirl gracefully across the screen. Ok, that's a stretch, but I had to work the dance thing in here somewhere. You may want to watch his demonstration video now.

When I saw the MXML code that Chet was using for his demo, I was struck by how similar it is to the way I would accomplish the same thing in JavaFX. Below is Chet's Flex 4 demo code:

<?xml version="1.0" encoding="utf-8"?>
<s:Application xmlns:fx="http://ns.adobe.com/mxml/2009"
    xmlns:d="http://ns.adobe.com/fxg/2008/dt"
    xmlns:s="library://ns.adobe.com/flex/spark">

    <fx:Declarations>
        <s:Parallel id="transformer" target="{button}">
            <s:Move xFrom="50" xTo="150" autoCenterTransform="true"/>
            <s:Rotate angleFrom="0" angleTo="360" autoCenterTransform="true"/>
            <s:Scale scaleXFrom="1" scaleXTo="2" autoCenterTransform="true"/>
        </s:Parallel>
    </fx:Declarations>

    <s:Button id="button" x="50" y="100" label="Transform Me"
        click="transformer.play()"/>
</s:Application>

And here is the same thing in JavaFX 1.2 formatted to emphasize the similarity:

import javafx.scene.Scene;
import javafx.scene.control.Button;
import javafx.animation.transition.*;

var transformer:ParallelTransition;

def button = Button { layoutX: 50, layoutY: 100, text: "Transform Me"
    action: function() { transformer.playFromStart() }
}

transformer = ParallelTransition {
    node: button
    content: [
        RotateTransition { fromAngle: 0, toAngle: 360 }
        TranslateTransition { fromX: 0, toX: 100 }
        ScaleTransition { fromX: 1, toX: 2 }
    ]
}

Scene {
    width: 400
    height: 300
    content: button
}

And here is the JavaFX application:

Some points of comparison:

  • MXML and XAML always lose me at xmlns. I'll take import statements any day, although most IDEs will manage XML namespaces and import statements for you. In general I simply prefer writing my declarative code in a programming language rather than a data interchange format - no matter how Flex-ible it is.
  • Deployment in a browser: Flex wins. Period. The deployment team at Sun has done a lot of work to narrow this particular gap, but Flash is still everywhere and it just works. I fully expect some significant number of people to have trouble running the applet above. And applets still flicker when the browser scrolls. Not serious, just annoying.
  • Flex has a slight edge in brevity, I think. But in return for some extra characters, you get all the benefits of static typing. The JavaFX compiler can catch syntax errors for you and IDEs will flag them immediately without having to run the program first. IDEs can also support much more robust refactoring and code completion (at least in theory, hopefully the Netbeans JavaFX plugin will finally get some more attention soon).
  • It seems odd that previous versions of Flex couldn't display text on a rotating control. And even these new transform effects have some gotchas to watch out for; like having to set autoCenterTransform on all the effects since they manipulate the same data under the covers. Not that JavaFX doesn't have some gotchas, but for the most part the foundation is solid. This kind of thing always surprises me when I hear about it. Flex is supposed to be way more mature, after all.
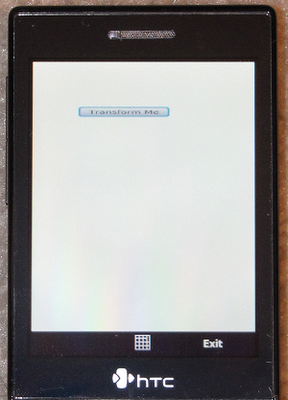
  • The JavaFX code above works on mobile devices (like the HTC Touch Diamond shown to the right) as well as on the desktop and in a browser. I'm just saying.

Twirling controls aside, you obviously can't make a definitive comparison of two competing technologies based on such a simple piece of sample code. I found it interesting how similar the code actually was between the two platforms. Hopefully you did too.

Wednesday, August 5, 2009

Steve at the SDForum

My good friend and co-author Stephen Chin has posted a screencast and slides from a talk he gave recently at the SDForum. Here is the link.

By the way, if you want to reproduce his greeting to the group using MigLayout, the code would look like this:

ResizableScene {
    width: 400
    height: 100
    fill: Color.GRAY
    content: MigLayout {
        constraints: "fill"
        content: [
            ResizableRectangle {
                effect: DropShadow{}
                fill: LinearGradient {
                    stops: [
                        Stop { color: Color.PURPLE }
                        Stop { color: Color.BLACK, offset: 1 }
                    ]
                }
                layoutInfo: nodeConstraints( "pos 20 20 container.x2-20 container.y2-20" )
            }
            Text {
                content: "Welcome SDForum Java SIG"
                font: Font.font( null, FontWeight.BOLD, 18 )
                fill: Color.WHITE
                layoutInfo: nodeConstraints( "center" )
            }
        ]
    }
}

No need for a Deck or a Border, MigLayout is all you need in this case. You can just use absolute positioning to create the 20 pixel border around the purple rectangle. And thanks to the container-relative positioning of MigLayout, the rectangle will resize with the scene just as in Steve's original demo.

Great presentation, Steve!

Monday, June 22, 2009

MigLayout for JavaFX Reloaded

JavaFX 1.2 brought many changes to the layout system in the JavaFX runtime. MigLayout for JavaFX has been fully updated to take advantage of these changes. The updated version is part of JFXtras v0.5 that was released a short time ago.

Getting Started with MigLayout

The first thing you need to do is download JFXtras version 0.5 and add the JFXtras-0.5.jar file to your project. You will also need to obtain the MigLayout v3.7 (for Java) jar file. This jar file is included in the JFXtras source distribution (in the lib directory) or you can get it directly from the MigLayout site. One other thing you should always keep handy is the MigLayout cheat sheet.

Simple Test

There are several examples of MigLayout usage included in the source distribution of JFXtras. You will find them in the tests/org/jfxtras/scene/layout directory. Let's start by taking a look at one of them: MigSimpleTest.fx. The code for this example is listed below.
package org.jfxtras.scene.layout;

import javafx.scene.shape.Rectangle;
import javafx.stage.Stage;
import javafx.scene.paint.Color;
import org.jfxtras.scene.ResizableScene;

Stage {
    title: "Mig Centering Test"
    scene: ResizableScene {
        width: 200
        height: 200
        fill: Color.PINK

        content: MigLayout {
            constraints: "fill"
            width: 100
            height: 100
            layoutInfo: MigNodeLayoutInfo {
                constraints: "center"
            }
        }
    }
}

This example shows the use of the layoutInfo variable that was added to the Node base class in JavaFX v1.2. The LayoutInfo class was created to provide a generic way of specifying layout constraints for any node in the scene graph. A subclass of LayoutInfo called MigNodeLayoutInfo is used to hold the specialized constraints string for a node in a MigLayout container. In the example above, the only node constraint specified is center which will keep the rectangle centered in the container.

Note: The node constraints string in the JavaFX version of MigLayout has the same syntax as the component constraints in the Java version. In JavaFX, we deal in nodes instead of components. See the MigLayout cheat sheet for details.
In this particular case, the rectangle also stays centered in the scene thanks to the use of a JFXtras ResizableScene which automatically passes resize information on to the MigLayout container.

LayoutInfo Convenience Functions

Setting the layoutInfo variable with a new MigNodeLayoutInfo class every time can get tedious. There are two convenience functions in the MigLayout class that reduce the amount of typing required. The first is the nodeConstraints function. It has the following signature:
public function nodeConstraints( constraints:String ):MigNodeLayoutInfo

This function simply constructs and returns a new MigNodeLayoutInfo object with the given constraints string. This is a module-level function in the MigLayout.fx file and therefore needs to be imported like this:

import org.jfxtras.scene.layout.MigLayout.*;
Using this new function, you might rewrite the Rectangle literal above as:
Rectangle {
    width: 100
    height: 100
    layoutInfo: nodeConstraints( "center" )
}
The second convenience function is named migNode and is used to associate a constraints string with a scene graph node that was created at some other point in the program. The function's signature is:
public function migNode( node:Node, constraints:String ):Node
This function is also a module-level function located in the MigLayout.fx file and therefore can be imported into your program using the same import statement as the one given above for the nodeConstraints function. Rewriting our simple test code to use this function might look something like this:
package org.jfxtras.scene.layout;

import javafx.scene.shape.Rectangle;
import javafx.stage.Stage;
import javafx.scene.paint.Color;
import org.jfxtras.scene.ResizableScene;
import org.jfxtras.scene.layout.MigLayout.*;

var blackRect = Rectangle {
    width: 100
    height: 100
}

Stage {
    title: "Mig Centering Test"
    scene: ResizableScene {
        width: 200
        height: 200
        fill: Color.PINK

        content: MigLayout {
            constraints: "fill"
            content: [
                migNode( blackRect, "center" )
               // ... other nodes are added here ...
            ]
        }
    }
}
This form is recommended when you have a non-trivial scene graph declaration. It allows you to easily see what nodes are being managed by your container and what their constraints are.

Migrating from a Previous Version

Those who have used MigLayout in JavaFX 1.0 or 1.1 will notice a few changes:

  • The layout constraints are now set using the constraints variable instead of the layout variable. The old name conflicts with the new layout facilities in JavaFX 1.2.
  • The fitParent variable has been removed from the MigLayout class. If you want your MigLayout container to expand to fill the entire scene, just use JFXtras' ResizeableScene class as above.
  • The MigNode class has been removed since it is no longer needed. The new layoutInfo variable in the Node class gives us a way to associate constraints with a node.
  • Since the MigNode class (and therefore MigNode.fx) no longer exists, the migNode convenience function was moved to the MigLayout.fx file.

Wrap Up

The MigLayout container released in JFXtras 0.5 was much improved for JavaFX 1.2. It not only incorporates the new layout system, but several bugs were fixed and it is now compatible with the latest release of MigLayout. There are more details about this updated version of MigLayout for JavaFX in the just-released Pro JavaFX™ Platform book of which I was fortunate enough to be a co-author.

Lastly, Amy Fowler has also updated her wonderful article on JavaFX layout. I highly recommend it!

Friday, June 12, 2009

Creating XYCharts in JavaFX

Note: This entry is the second in a series on the new chart components in JavaFX 1.2. Like the first entry, this one is also an excerpt from the upcoming "Pro JavaFX Platform" book written by Jim Weaver, Stephen Chin, Weiqi Gao, and myself. You can find out more by clicking on the book image to the right of this page. -- Dean The remaining five types of charts are all meant to work with XY data. These charts are all subtypes of the XYChart base class. As such they are rendered against a background grid and include a horizontal and vertical axis. Bar Chart A bar chart plots data from a sequence of BarChart.Series objects. Each series contains a sequence of BarChart.Data objects that each contains the value (the height of the bar) and the category that the bar belongs to. Therefore a bar chart data object can be declared as shown in the following code snippet.
BarChart.Data {
  category: “Category Name”
  value: 42
}
The horizontal axis for the bar chart is of type CategoryAxis. The public categories sequence variable must contain category names that match those given to the BarChart.Data objects. The vertical axis of a bar chart is a ValueAxis. As of JavaFX 1.2, the only concrete implementation of a ValueAxis is the NumberAxis class. A NumberAxis represents a range of numeric values and has variables that allow for control over the appearance and the number of tick marks and label that are shown along the axis. A typical axis declaration for a bar chart is shown in the listing below. The code declares a category axis with three categories and a number axis that ranges from 0 to 100 with a labeled tick mark every 20 units for a total of 6 labels (counting the label at 0).
BarChart {
  categoryAxis: CategoryAxis {
    categories: [ "Category 1", "Category 2", "Category 3" ]
  }
  valueAxis: NumberAxis {
    label: "Y Axis"
    upperBound: 100
    tickUnit: 20
  }
}
The next listing shows a complete program that displays a bar chart showing the sales report for Acme, Incorporated from 2007 to 2009. The data to be displayed in the chart is defined at the top. Each year will be it’s own category. The data values are generated from the sales figures for each of the three products over the three different years. The vertical axis is a NumberAxis that shows the number of units sold and is defined such that it can accommodate the largest sales value. It will have a labeled tick mark every 1,000 units starting at 0 and ending at 3,000. This gives a total of four labels along the vertical axis. The public data variable accepts the sequence of BarChart.Series objects to plot. Each BarChart.Series object also has its own public data variable, which accepts a sequence of BarChart.Data objects. A for expression is used to generate the actual sequence of BarChart.Data objects from the sequences defined at the beginning of the listing. Finally, the categoryGap variable (highlighted) is used to increase the spacing between the yearly data to provide more differentiation between the categories. The complete source code is in the BarChartIntro.fx file from the ChartIntro example project.
def years = [ "2007", "2008", "2009" ];
def anvilsSold = [  567, 1292, 2423 ];
def skatesSold = [  956, 1665, 2559 ];
def pillsSold = [ 1154, 1927, 2774 ];

Stage {
  title: "Bar Chart Intro"
  scene: Scene {
    content: [
      BarChart {
        title: "Acme, Inc. Sales Report"
        titleFont: Font { size: 24 }
        categoryGap: 25
        categoryAxis: CategoryAxis {
          categories: years
        }
        valueAxis: NumberAxis {
          label: "Units Sold"
          upperBound: 3000
          tickUnit: 1000
        }
        data: [
          BarChart.Series {
            name: "Anvils"
            data: for (j in [0..<sizeof years]) {
              BarChart.Data {
                category: years[j]
                value: anvilsSold[j]
              }
            }
          }
          BarChart.Series {
            name: "Rocket Skates"
            data: for (j in [0..<sizeof years]) {
              BarChart.Data {
                category: years[j]
                value: skatesSold[j]
              }
            }
          }
          BarChart.Series {
            name: "Earthquake Pills"
            data: for (j in [0..<sizeof years]) {
              BarChart.Data {
                category: years[j]
                value: pillsSold[j]
              }
            }
          }
        ]
      }
    ]
  }
}
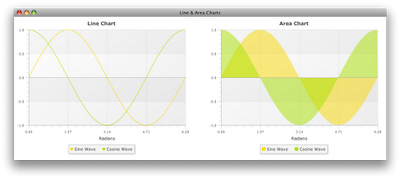
Caution If you forget to declare the axes for a XYChart then no data will show up on your chart. This is one of the few times you cannot rely on the default values of the chart. In the previous example, if the CategoryAxis or the ValueAxis were left undeclared then no bars would have been drawn on the sales chart. The resulting chart is shown in below. Much like the pie charts, the default look for bar charts is a clean, modern look with lighting and shading affects built right in. There is also a drop-in replacement for BarChart named BarChart3D, which can be used to give the chart a 3-dimensional appearance. Line and Area Charts A line chart can be constructed using the LineChart class. It can show one or more LineChart.Series objects each of which contain a sequence of LineChart.Data objects. This pattern should be familiar now. It is the same for an AreaChart, whose data variable accepts a sequence of AreaChart.Series objects each of which contain a sequence of AreaChart.Data objects. We will use these charts to plot the mathematical functions sine and cosine as shown here: The source code for this program can be found in the LineAreaChartIntro.fx file in the ChartIntro example project. To plot the sine and cosine functions, we need to create a horizontal axis that goes from 0 to 2π and a vertical axis that goes from -1.0 to 1.0. The listing below shows two functions that generate these NumberAxis objects. You may be wondering why these axis objects are being generated by functions rather than just declaring them as variables and reusing them for both charts. The answer lies in the fact that the Axis base class is derived from Node. Like any Node, an Axis can only appear in the scene graph once. Since we are not allowed share these axis objects between our two charts, we must write functions that create new axis objects each time they are called.
/**
 * An x axis that goes from 0 to 2*PI with labels every PI/2 radians.
 * The labels are formatted to display on 2 significant digits.
 */
function createXAxis() {
  NumberAxis {
    label: "Radians"
    upperBound: 2 * Math.PI
    tickUnit: Math.PI / 2
    formatTickLabel: function(value) {
      "{%.2f value}"
    }
  }
}

/**
 * A y axis that that goes from -1 to 1 with labels every 0.5 units.
 */
function createYAxis() {
  NumberAxis {
    upperBound: 1.0
    lowerBound: -1.0
    tickUnit: 0.5
  }
}
The createXAxis function illustrates the use of the formatTickLabel function variable to format the values that will be used as tick labels on the axis. In this case, we format the numbers to keep only two significant digits after the decimal point. In addition, the code to create the y-axis shows how to set a non-zero lower bound for an axis. The next code listing shows the code that creates the LineChart object and adds it to the scene. This code follows the same pattern we’ve seen before. LineChart has a public data variable that takes a sequence of LineChart.Series objects. In this case we have one sequence for the sine wave and one for the cosine wave. Within each series, the data sequence is populated by a range expression that generates the LineChart.Data objects, which correspond to the points along the sine or cosine curves. Since we can’t show any data without our axes, we use the createXAxis and createYAxis functions shown earlier. Normally a line chart will plot a symbol at each data point – a circle, triangle, square or some such shape. The lines of the chart then connect these symbols. In this case, we have so many data points that the symbols would obscure the lines. So we tell the chart not to generate the symbols by setting the showSymbols variable to false. Another default setting for line charts is for the data to cast a shadow on the chart’s background. Since this makes the lines of this particular chart more difficult to see we turn off the drop shadow by setting dataEffect to null.
function createAreaChart() {
  AreaChart {
    title: "Area Chart"
    translateX: 550
    xAxis: createXAxis()
    yAxis: createYAxis()
    data: [
      AreaChart.Series {
        name: "Sine Wave"
        data: for (rads in [0..2*Math.PI step 0.01]) {
          AreaChart.Data {
            xValue: rads
            yValue: Math.sin( rads )
          }
        }
      }
      AreaChart.Series {
        name: "Cosine Wave"
        data: for (rads in [0..2*Math.PI step 0.01]) {
          AreaChart.Data {
            xValue: rads
            yValue: Math.cos( rads )
          }
        }
      }
    ]
  }
}
Scatter and Bubble Charts Scatter and bubble charts are just like the other three XY charts we’ve looked at. The classes, ScatterChart and BubbleChart respectively, have a public data variable that accepts a sequence of series object. You guessed it: ScatterChart.Series and BubbleChart.Series. Each of these series has a public data variable that holds a sequence of their respective data objects: ScatterChart.Data and BubbleChart.Data. However, the BubbleChart.Data class also contains a radius variable that is used to set the size of the bubble for each data point. The figure below shows an example of a scatter chart and a bubble chart. In this program, the charts are just plotting the distribution of points generated by the javafx.util.Math.random function. Using the JavaFX math functions allow our code to remain portable to mobile devices. We will discuss that more in Chapter 10. The radius of the bubbles in the bubble chart is determined by the order in which the points are generated. The bubbles start small and get bigger as points are generated. You can roughly tell the order in which each point was generated. This is simply an interesting way to view the randomness of the random number generator. The code for this program is found in ScatterBubbleChartIntro.fx in the ChartIntro example project. The code to create a scatter chart is pretty straightforward. First we define a function that creates a number axis that ranges from 0.00 to 1.00 with labels every 0.25 units. The tick labels are once again formatted to keep only 2 digits after the decimal points. The createAxis function itself takes a String parameter to use as the label for the number axis. This allows the reuse of the function to create labels for both the x- and y-axes. The ScatterChart has only one data series and that series contains a sequence of 100 data objects whose x and y values are generated randomly. The only extra bit of customization done here is to hide the legend since we do only have the one data series.
/**
 * An x axis that goes from 0 to 1.0 and displays labels every 0.25 units.
 * The labels are formatted to display on 2 significant digits.
 */
function createAxis( label:String ) {
  NumberAxis {
    label: label
    upperBound: 1.0
    tickUnit: 0.25
    formatTickLabel: function(value) {
      "{%.2f value}"
    }
  }
}

/**
 * Create a scatter chart that displays random points.
 */
function createScatterChart() {
  ScatterChart {
    title: "Scatter Chart"
    legendVisible: false
    xAxis: createAxis( "X Axis" )
    yAxis: createAxis( "Y Axis" )
    data: [
      ScatterChart.Series {
        data: for (i in [1..100]) {
          ScatterChart.Data {
            xValue: Math.random()
            yValue: Math.random()
          }
        }
      }
    ]
  }
}
The source code that creates the bubble chart, shown below, is very similar. The big difference here is the radius variable of the BubbleChart.Data class. This is unique to the bubble chart data and, as previously mentioned, allows us to control the size of the bubble on the plot. The radius values scale based on the axes of the plot. In our case the axes both go from 0.0 to 1.0. Therefore a bubble radius of 0.5 would create a bubble that filled the entire chart (if centered) since its diameter would be 1.0. If our axes went from 0 to 10 instead, then a bubble with a radius of 0.5 would be smaller, taking up only 1/10 of the chart. The code in the listing below creates bubbles whose radius varies from 0.001 to 0.1 as the value of i goes from 1 to 100.
function createBubbleChart() {
  BubbleChart {
    title: "Bubble Chart"
    legendVisible: false
    translateX: 550
    xAxis: createAxis( "X Axis" )
    yAxis: createAxis( "Y Axis" )
    data: [
      BubbleChart.Series {
        data: for (i in [1..100]) {
          BubbleChart.Data {
            xValue: Math.random()
            yValue: Math.random()
            radius: i / 1000.0
          }
        }
      }
    ]
  }
}
This concludes part two of this series. In the third and final excerpt, we will take a look at adding interaction to your charts and all of the customization options available in the chart API.

Tuesday, June 9, 2009

Creating Charts in JavaFX

Note: This entry is an excerpt from the upcoming "Pro JavaFX Platform" book written by Jim Weaver, Stephen Chin, Weiqi Gao, and myself. You can find out more by clicking on the book image to the right of this page. -- Dean The chart components included in JavaFX give developers an easy way to let the users of their applications visualize a wide variety of data. There are six kinds of charts supported in JavaFX 1.2:
  • An Area Chart displays quantitative data like a line chart but with the area between the line and the horizontal axis shaded. Good for comparing the magnitude of two or more series of data.
  • The Bar Chart is a good way to show data in a way that makes it easy to see how the data changes over time or under a set of different conditions. The data is represented as rectangular area or, in the case of a 3D chart, a cubic volume whose height corresponds to the value of the data point being displayed.
  • Bubble Charts plot data points on a 2-dimensional grid and have the extra ability to display the relative magnitudes of the data by controlling the diameter of the point (or bubble) displayed at each XY coordinate.
  • A Line Chart is a simple way to display 2-dimensional data points where each point is connected to the next point in the data series by a line.
  • Pie Charts are typically used to display the relative percentages of a series of values on a circle. The value of each piece of data, as a percentage of the total, dictates how much of the circle’s area it takes up. In other words, the chart shows how big a slice of the pie each value represents.
  • The Scatter Chart is used to plot the points of one or more series of data. These charts are typically used to show the correlation (or not) of the data by comparing how the data points are clustered (or not).
One of these things is not like the others. Other than the pie chart, all of these charts are meant to handle 2-dimensional data points as pairs of XY coordinates. The class hierarchy, shown below, of the chart components in the javafx.scene.chart package reflects this fact. The ChartDemo program, which is included with the Chapter 5 examples and is shown below, displays an example of each of these types of charts. In the next sections we’ll take a look at how to use each of these different charts and the many different ways that they can be customized.
Click the image to launch the demo
Common Chart Properties The Chart abstract base class contains several public variables that are common to all charts. One such property that all charts share is a title. The following public variables in the Chart class control the style, position, and content of the title displayed on a chart.
  • title is a String whose contents will be displayed as the title of the chart. Setting this variable to null or an empty string (its default value) causes the chart to be rendered without a title.
  • titleFill controls the fill color of the title text. Since it is of type Paint, it can be a solid color as well as a linear or radial gradient.
  • titleFont allows you to set the Font to be used to render the title text.
  • titleGap is a Number that specifies the number of pixels to leave as a gap between the title and the content of the chart.
  • titleSide is an enumeration that specifies which side of the chart the title will appear on. Its type is javafx.scene.chart.part.Side and its possible values are TOP, BOTTOM, LEFT, and RIGHT.
All charts are also capable of displaying a legend. The legend is very useful when your charts are displaying more than one data series. It allows the user to easily see which of the plotted data points belongs to each of the data series. The public variables below affect how the legend is presented on a chart.
  • legendGap is a Number that specifies the number of pixels to leave as a gap between the legend and the content of the chart.
  • legendSide specifies which side of the chart the legend will appear on. Like titleSide, the possible values are TOP, BOTTOM, LEFT, and RIGHT.
  • legendVisible is a Boolean value that controls whether the legend will be shown on the chart or hidden.
The Chart class also has a public-read variable named legend that provides a reference to the actual Legend object used by the chart. This object can be used to customize many aspects of the legend and will be discussed later in the section on customization. Pie Chart Getting a basic pie chart on the screen is very straightforward. All you really need is a sequence of PieChart.Data objects and a title string. For each value that you want to display in your pie chart you just create a PieChart.Data object and supply the value and a text string to use as the label for the value. The sequence of data objects is then used in the pie chart’s declaration. Since every chart is-a Node, you can just insert the chart into your scene graph in order to display it. The listing below demonstrates how to create and display a PieChart. Notice that we have used the titleFont variable to make the chart’s title stand out a little more. The source code is from PieChartIntro.fx, which can be found in the ChartIntro example project.
Stage {
  title: "Pie Chart"
  scene: Scene {
    content: [
      PieChart {
        title: "What Is Your Favorite Pie?"
        titleFont: Font { size: 24 }
        data: [
          PieChart.Data {
            value: 21
            label: "Pumpkin"
          }
          PieChart.Data {
            value: 33
            label: "Apple"
          }
          PieChart.Data {
            value: 17
            label: "Cherry"
          }
          PieChart.Data {
            value: 29
            label: "3.14159"
          }
        ]
      }
    ]
  }
}
This chart is rendered as shown in the image below. Note that right out of the box, the charts have a modern look with lighting and shading effects baked right in. You can also see that by default the title appears at the top of the chart. If you prefer a more 3-dimensional look to your pie charts, you can use the PieChart3D class instead of a PieChart. Everything in the listing above (aside from the class name) can remain the same and the result will have the appearance of a 3-dimensional disk instead of a circle. That concludes this entry. In the next entry, I'll continue this excerpt by taking a closer look at XYCharts.

Sunday, June 7, 2009

Old Posts

For reference, here are some posts from my old blog at java.net and some of my posts from javafxpert.com: A Guide to the Future (of Swing Applications): March 19, 2007 Swing Application Framework Hacks Unleashed For Smarty Pantses: April 2, 2007 Beans Binding For Me? You Shouldn't Have: April 3, 2007 JavaFX Skins Game: January 1, 2009 Part 3 of Building a JavaFX Calculator: January 15, 2009 Spotlight Effects for JavaFX: January 25, 2009